Car Value Tracker
Lead Product Designer | Web | 2023
Overview
People track their stocks & shares and their house value, so why not track the second most valuable asset they own? We know that our sellers do research prior to selling, so we saw an opportunity to become a destination for unique & relevant data insights.
The Car Value Tracker was created to reach new and existing customers outside of the core selling funnel, establishing Motorway as the place to come for all things to do with your vehicle.
Goals: Increase customer retention by 20% and increase ‘value my car’ SEO.
Role
Senior Product Designer
Workshop facilitation, Stakeholder management, Rapid prototyping, User research, Visual design,
Teammembers
1 x Product Manager, 2 x Frontend developers 3 x Backend developers 1 x Agile Delivery Manager
Timescale
October 2022 - Jan 2023
The challenge
Brand new, industry first product. Many have the opinion why would I want to see the value when I know its decreasing, but through extensive interviews and testing we realise that is not the majority of people, rather we should look at this as how can they use this data to make an informed decision about their vehicle.
Who is this for?
- Users that want to know value and running costs of their vehicle
- Users that want to know if their car will/is holding its value.
- Users that are thinking about selling (or buying) in the future
Problem statement: I want to understand the value of my vehicle as one of my assets, so I can make informed decisions regarding it.
Hypothesis: We believe that, by providing valuations and pricing insights, we can help car owners track their vehicles as an asset.
The Solution
In the process of redesigning the Motorway homepage, we initiated a series of strategic actions to ensure optimum results.
Firstly, I conducted a workshop that brought together key members of our team - the brand design team, the Product Manager, and the Content Designer. This collaborative initiative was aimed at dissecting and understanding the research we had gathered so far. We critically assessed how our existing website was addressing the key themes that had emerged from our research and brainstormed on potential strategies we could adopt to address these themes more effectively.
As this is a brand new entry point within the upper funnel, we wanted to make sure that we had all bases covered when users are receiving a valuation, returning to the platform and then opting to sell their car at the time that suits them. Its vital we ensured that no user information was lost as its a new journey, and CRM was mapped correctly so users don't get overwhelmed with double the amount of emails.
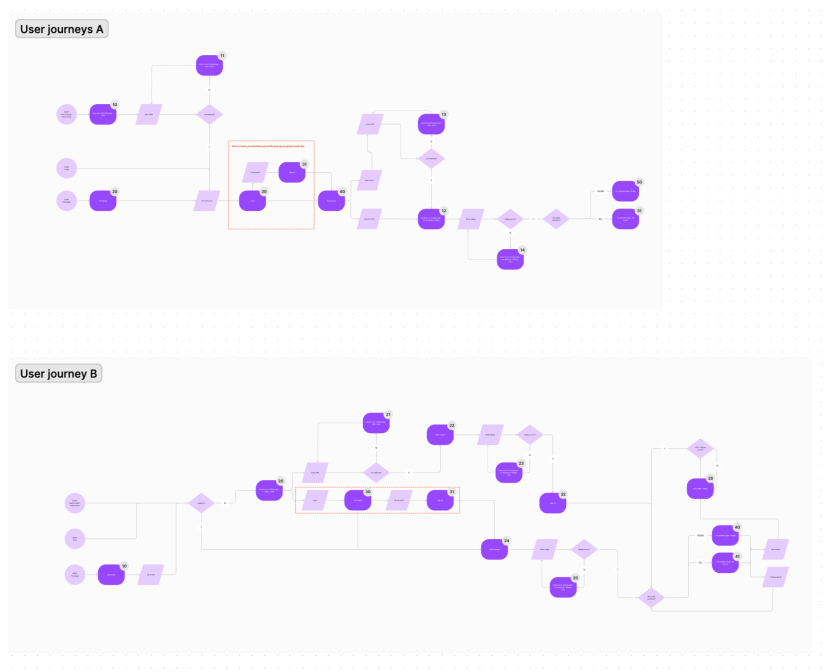
We needed to create low to mid-fidelity wireframes so that we can test with users. We narrowed the search of our users to three categories:
- Those who have used motorway once and not sold their car
- Those that have used motorway several times for valuations of the same vehicle
- Those that have used Motorway several times to sell multiple vehicles
The wire-framing stage was also a great opportunity to involve stakeholders to input on copy (this is the company process) and to showcase this to our users to see how they interpret the information shown to them. As this is a industry first tool, we wanted to understand how users will be able to understand what we are showing them, to see what is most important to them when surfacing the data, and what area we can look to improve either now or later.
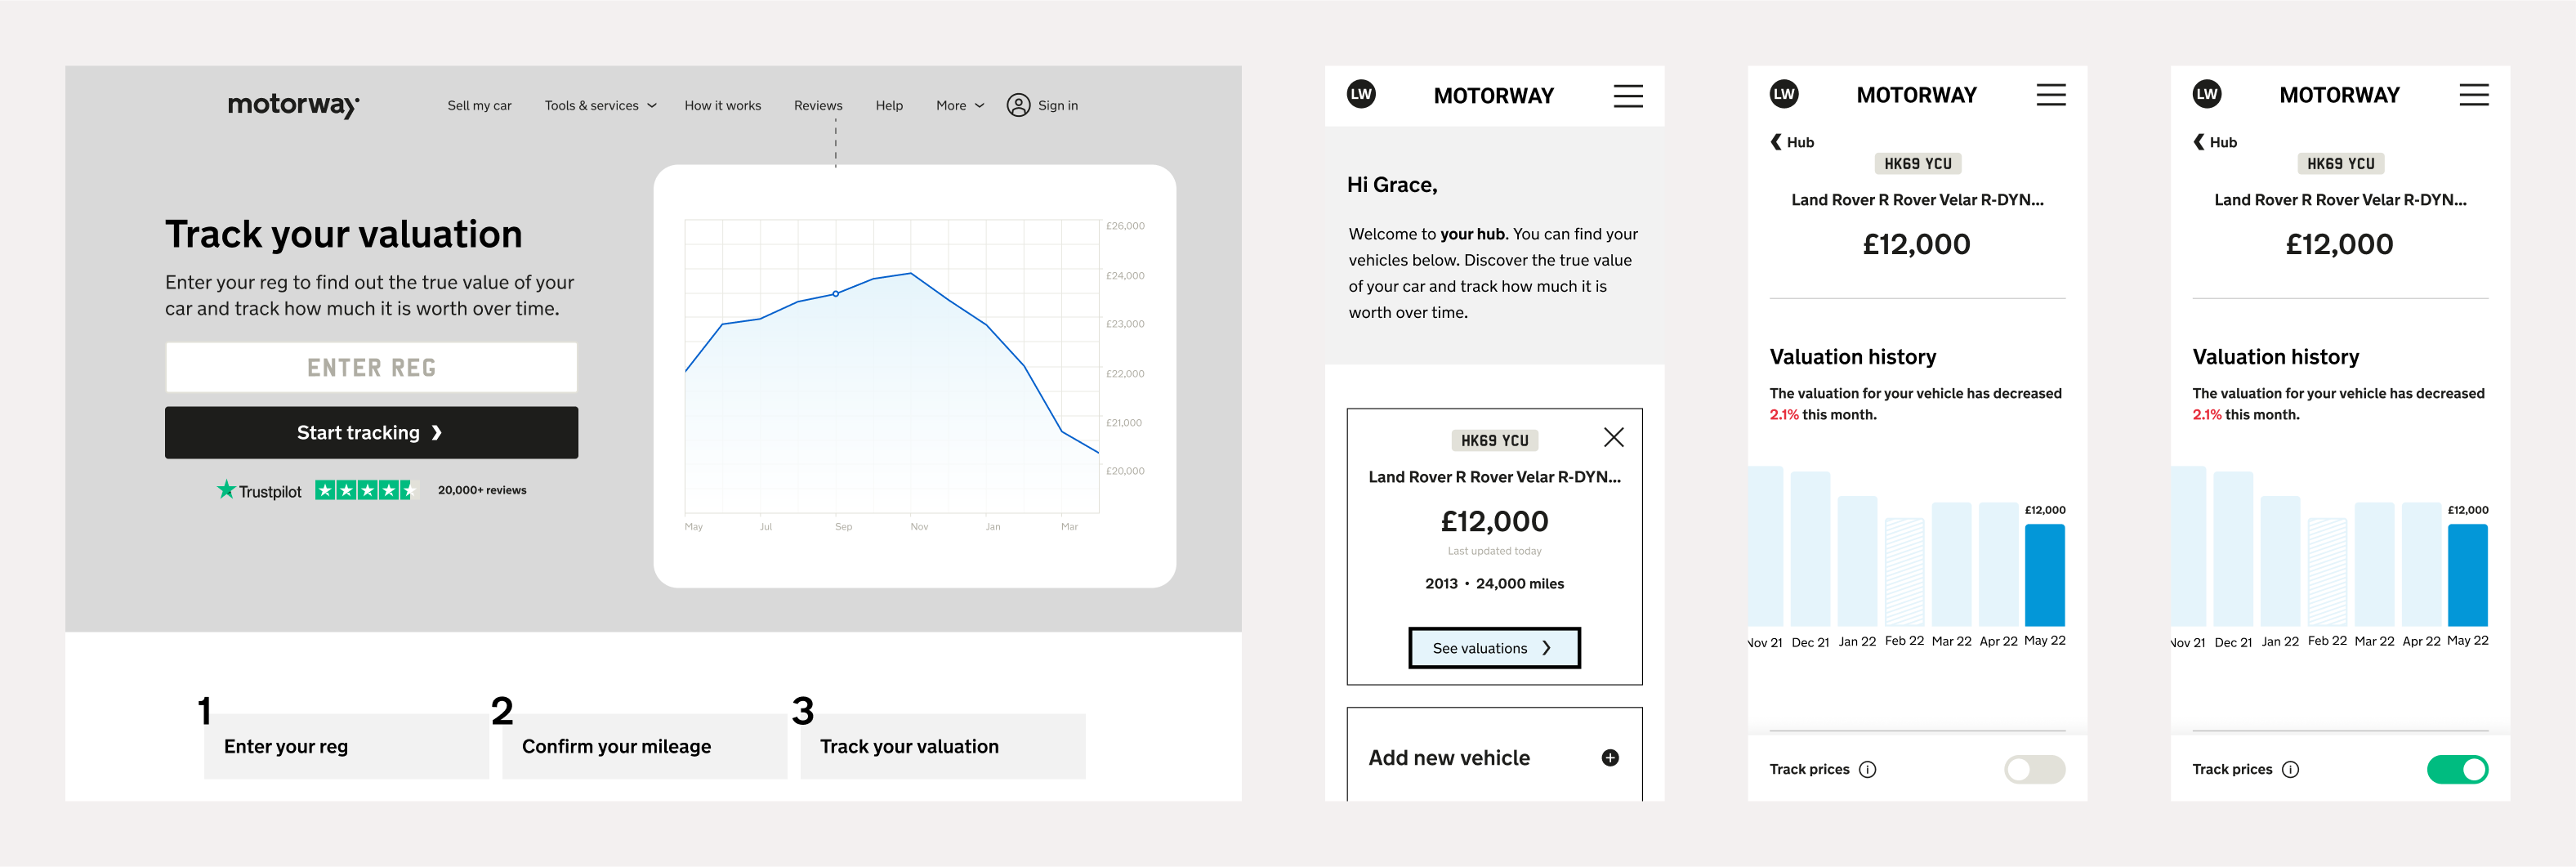
Created mid-fi wireframes in order to test the product with users, setting out to test our hypothesis and understand the types of user for the platform.
The data alone wouldn't be enough for our users, they need to be able to trust that the data we are showing is legitimate. We know that users explore various different sites such as autotrader to learn about the price of their vehicle. To show the validity of the data we wanted to showcase vehicles that are similar to the one the user is tracking. I ran a workshop with the design team to come up with ideas on how we can display them in the best way.
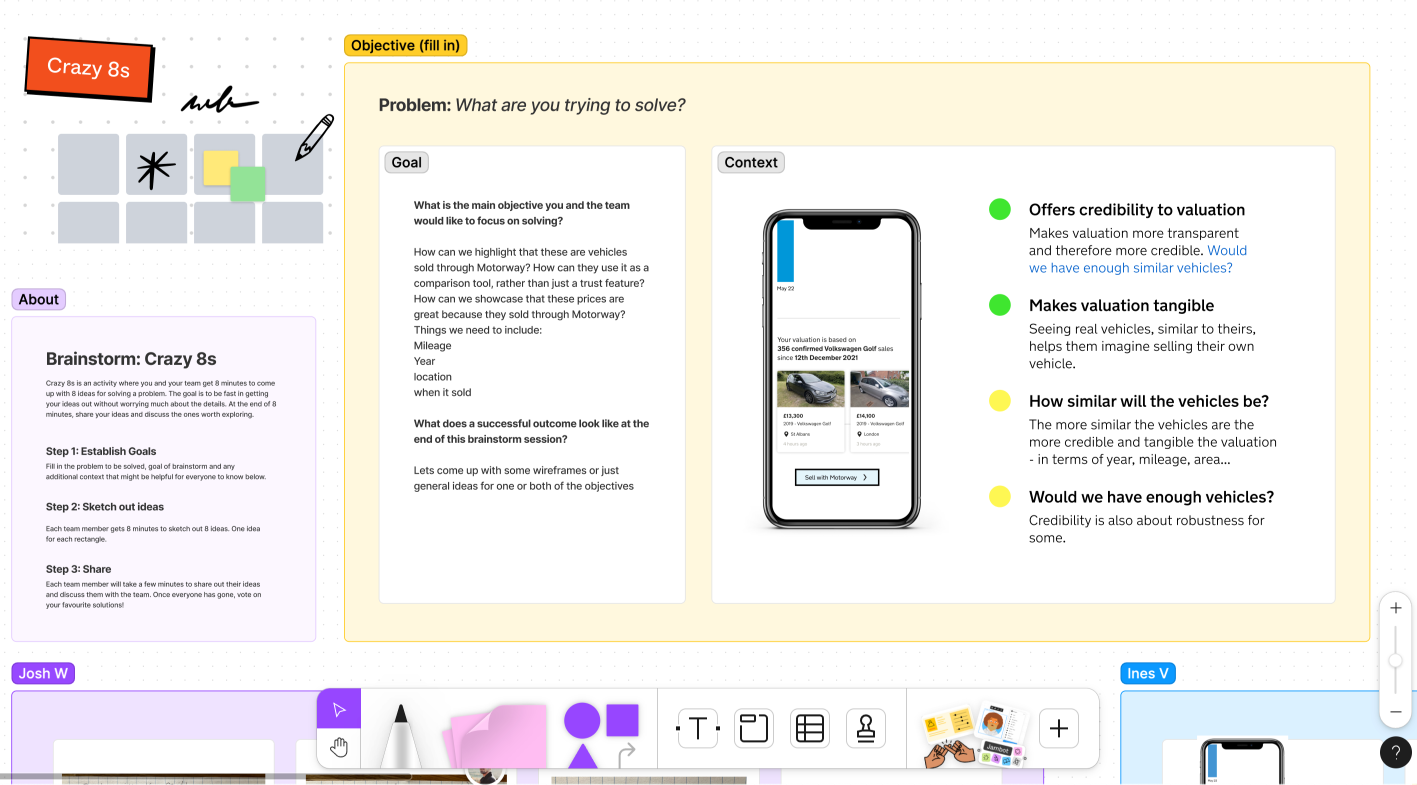
To show the validity of the data we wanted to showcase vehicles that are similar to the one the user is tracking. I ran a workshop with the design team to come up with ideas on how we can display them in the best way. We came up with a variety of solutions, for now and also post launch.
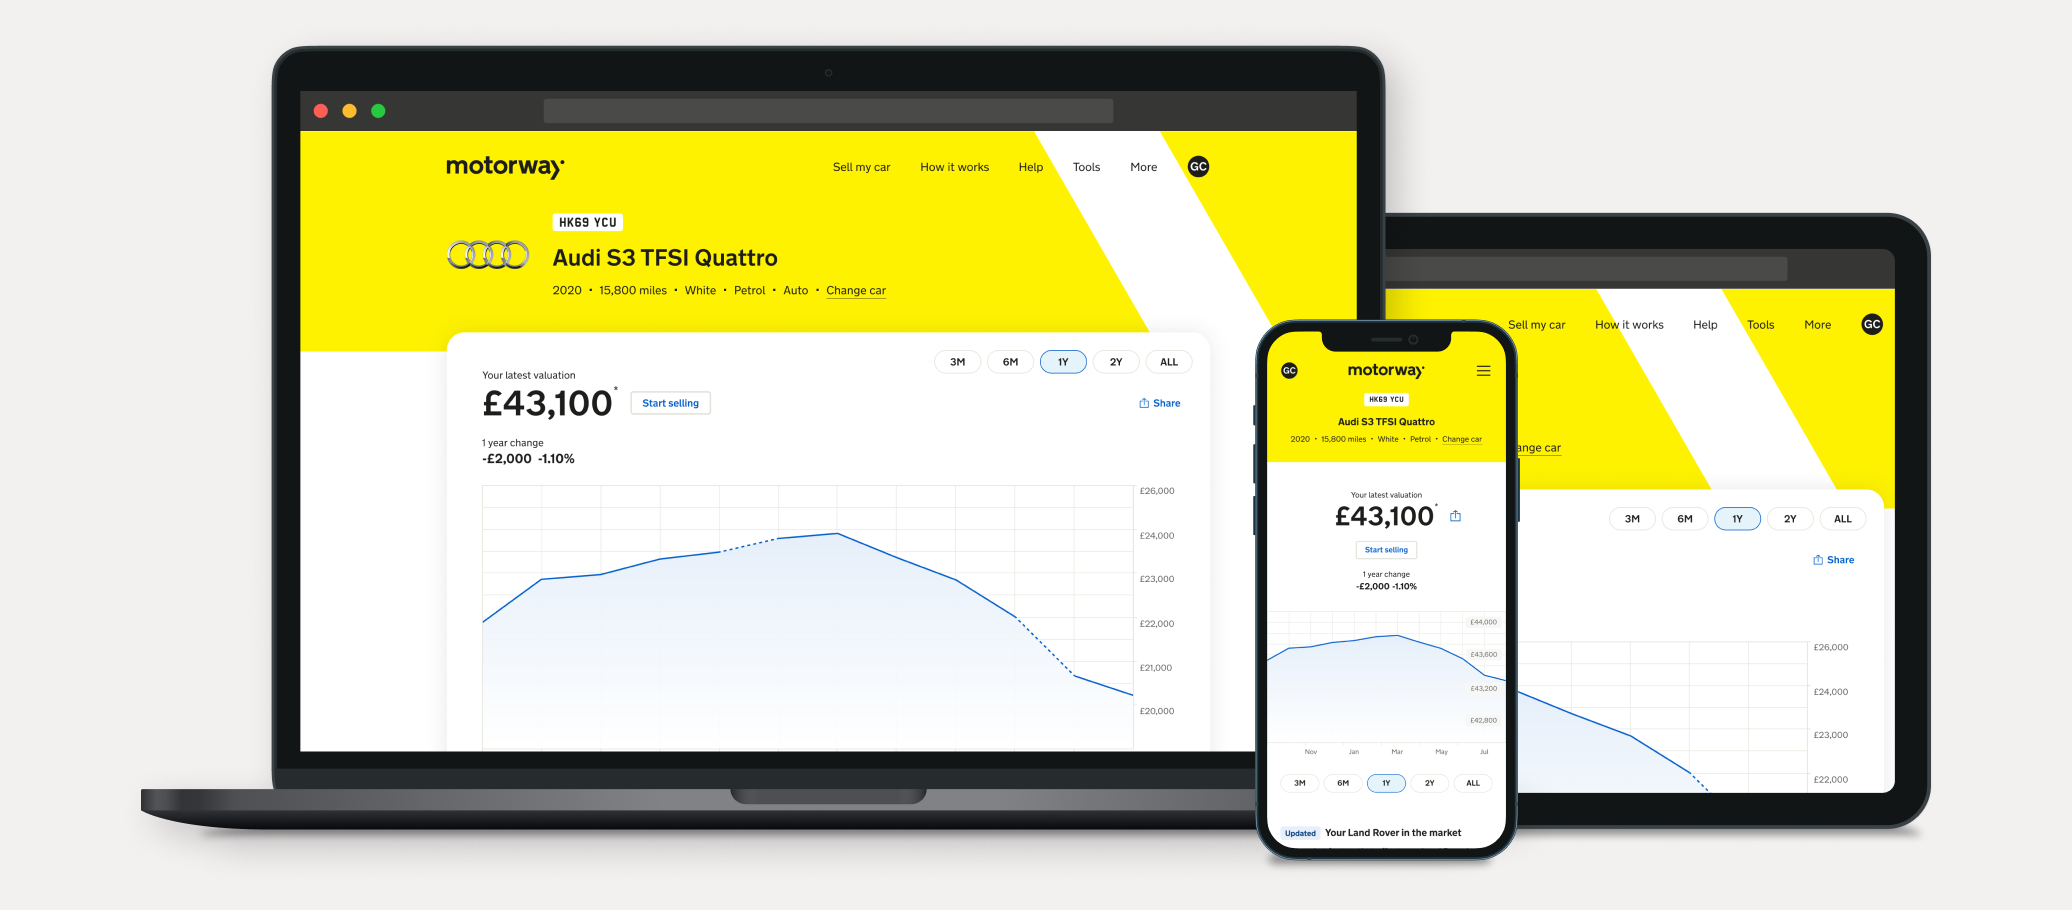
The CVT went live January 2023, and we have improved upon it since then, with many more features in addition on the roadmap.We have slowly been including it within our products, improving the Motorway account page bringing focus to CVT within each card, to updating the UI of the ULEZ checker results page to include CVT, utilising the 2023 zone expansion to increase visits of the Car Value Tracker, as well as sign ups to Motorway.
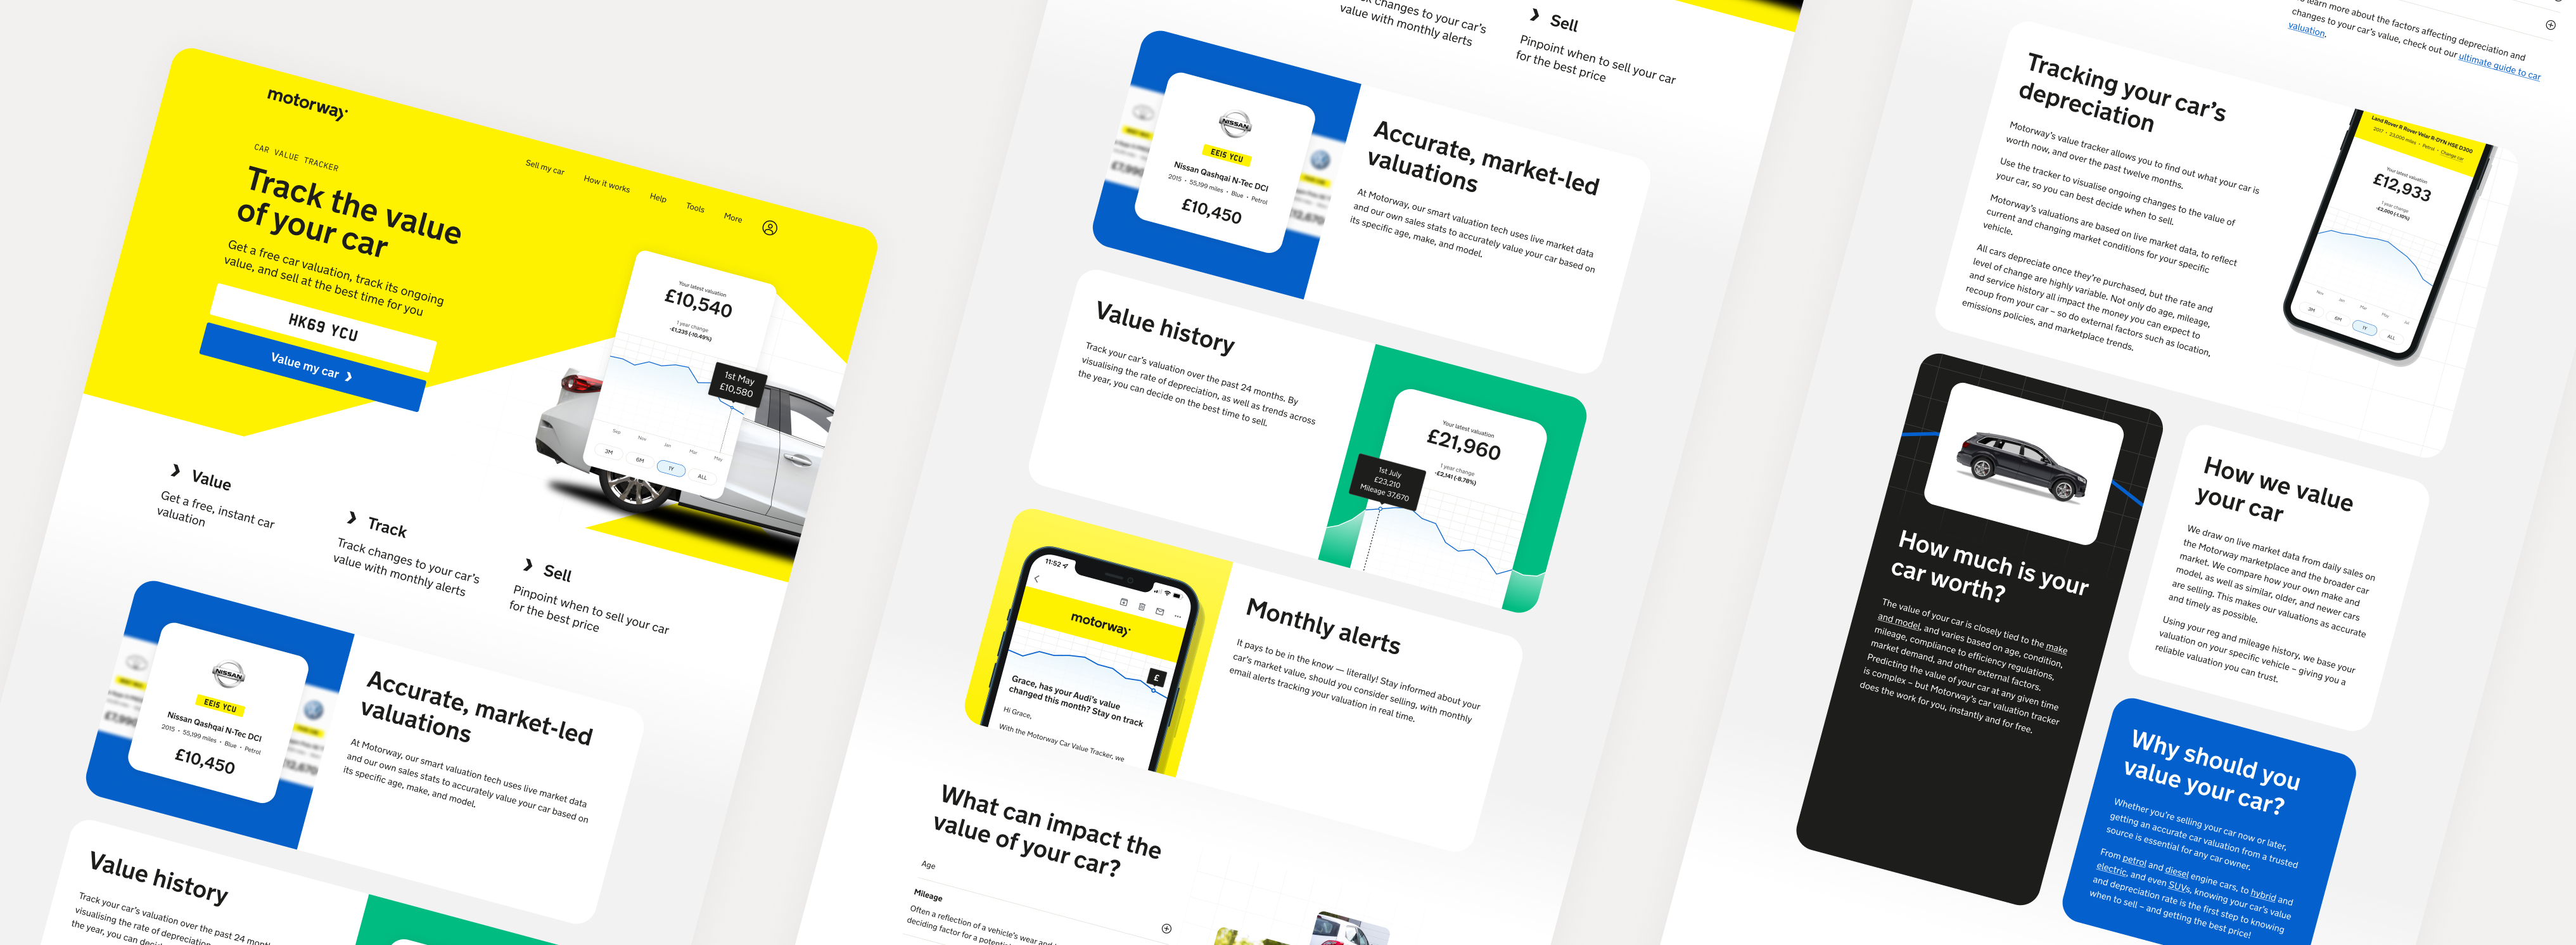
Shots of the CVT landing page. The majority of this work was to triel a new way of visualising SEO content, as well as product shots throughout the page as that's not something we have done previously.
Due to the limitations of the MVP, I was not able to design the product the way I had invisaged, as we wanted to ensure that the users would be able to tap through the graph to see as much useful information as possible no matter the device. For future versions we want to use scrubbing through the graph, and therefore adjust the UI to be a cleaner and updated graph.
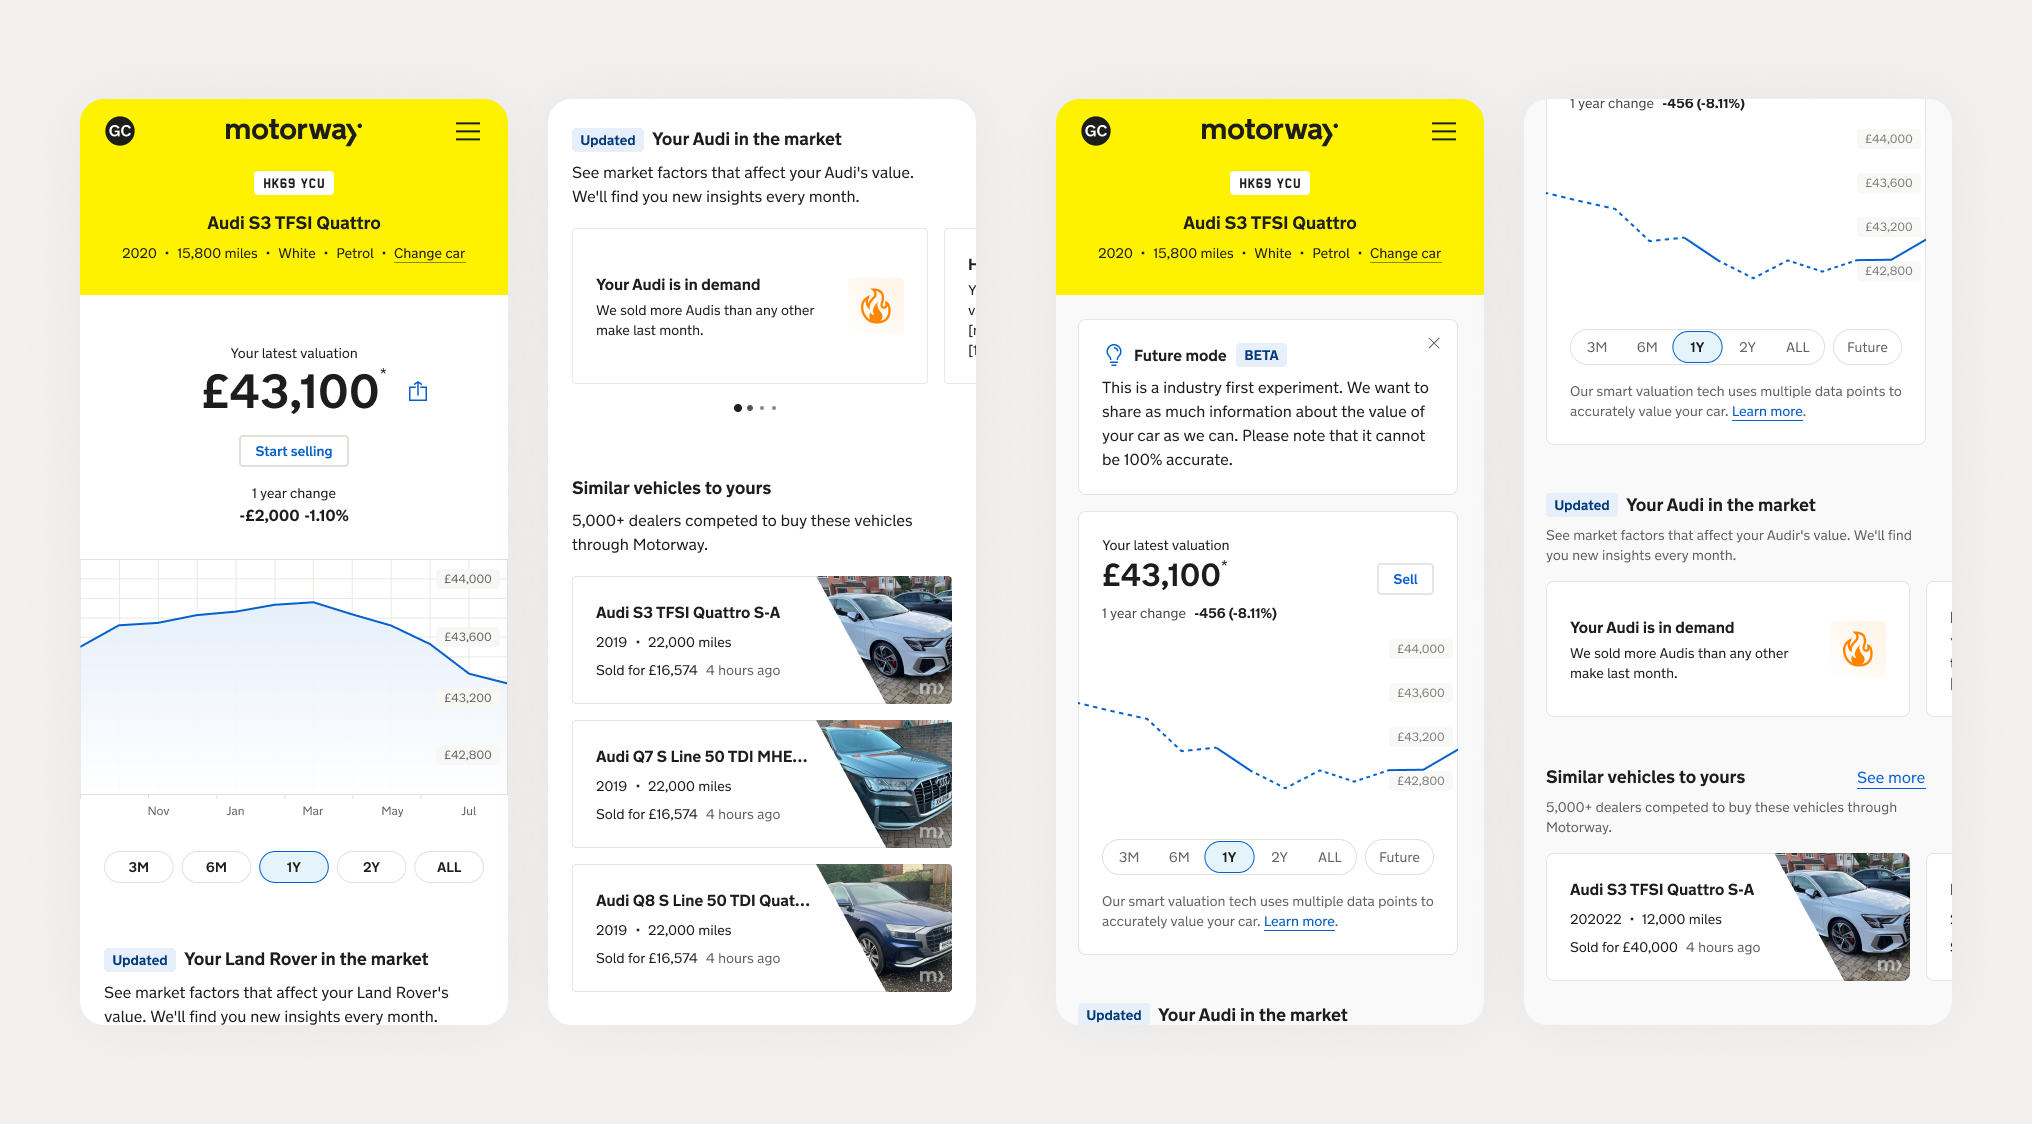
The first two are live, the second two are vision pieces of what I think CVT will become.
Results & metrics
Through continuous research since release, we have been able to determine that our users are benefitting from the Car Value Tracker, and are utilising the data provided for various different use cases.
We have validated that the CVT is not only retaining our users month on month, but also it is converting users to offer select at a much higher rate than the normal selling journey.
20%
higher offer select rate than the original selling journey
10%
higher offer to ready for sale rate than original selling journey
The next steps after release was to figure out how we can further improve on this, is it through further data we can showcase, or is it new stand alone tools? We released since then our vehicle insights, where we can show monthly updated data points, showing if their vehicle is in demand, if the valuation is particularly high that month, and many more.